Data study
Europe’s most welcoming cities, according to locals
We asked the data a simple question: where do residents say their city is a good place to live for everyone? The EU’s 2023 survey asked people in 83 cities about six groups, from families to immigrants.
The short answer
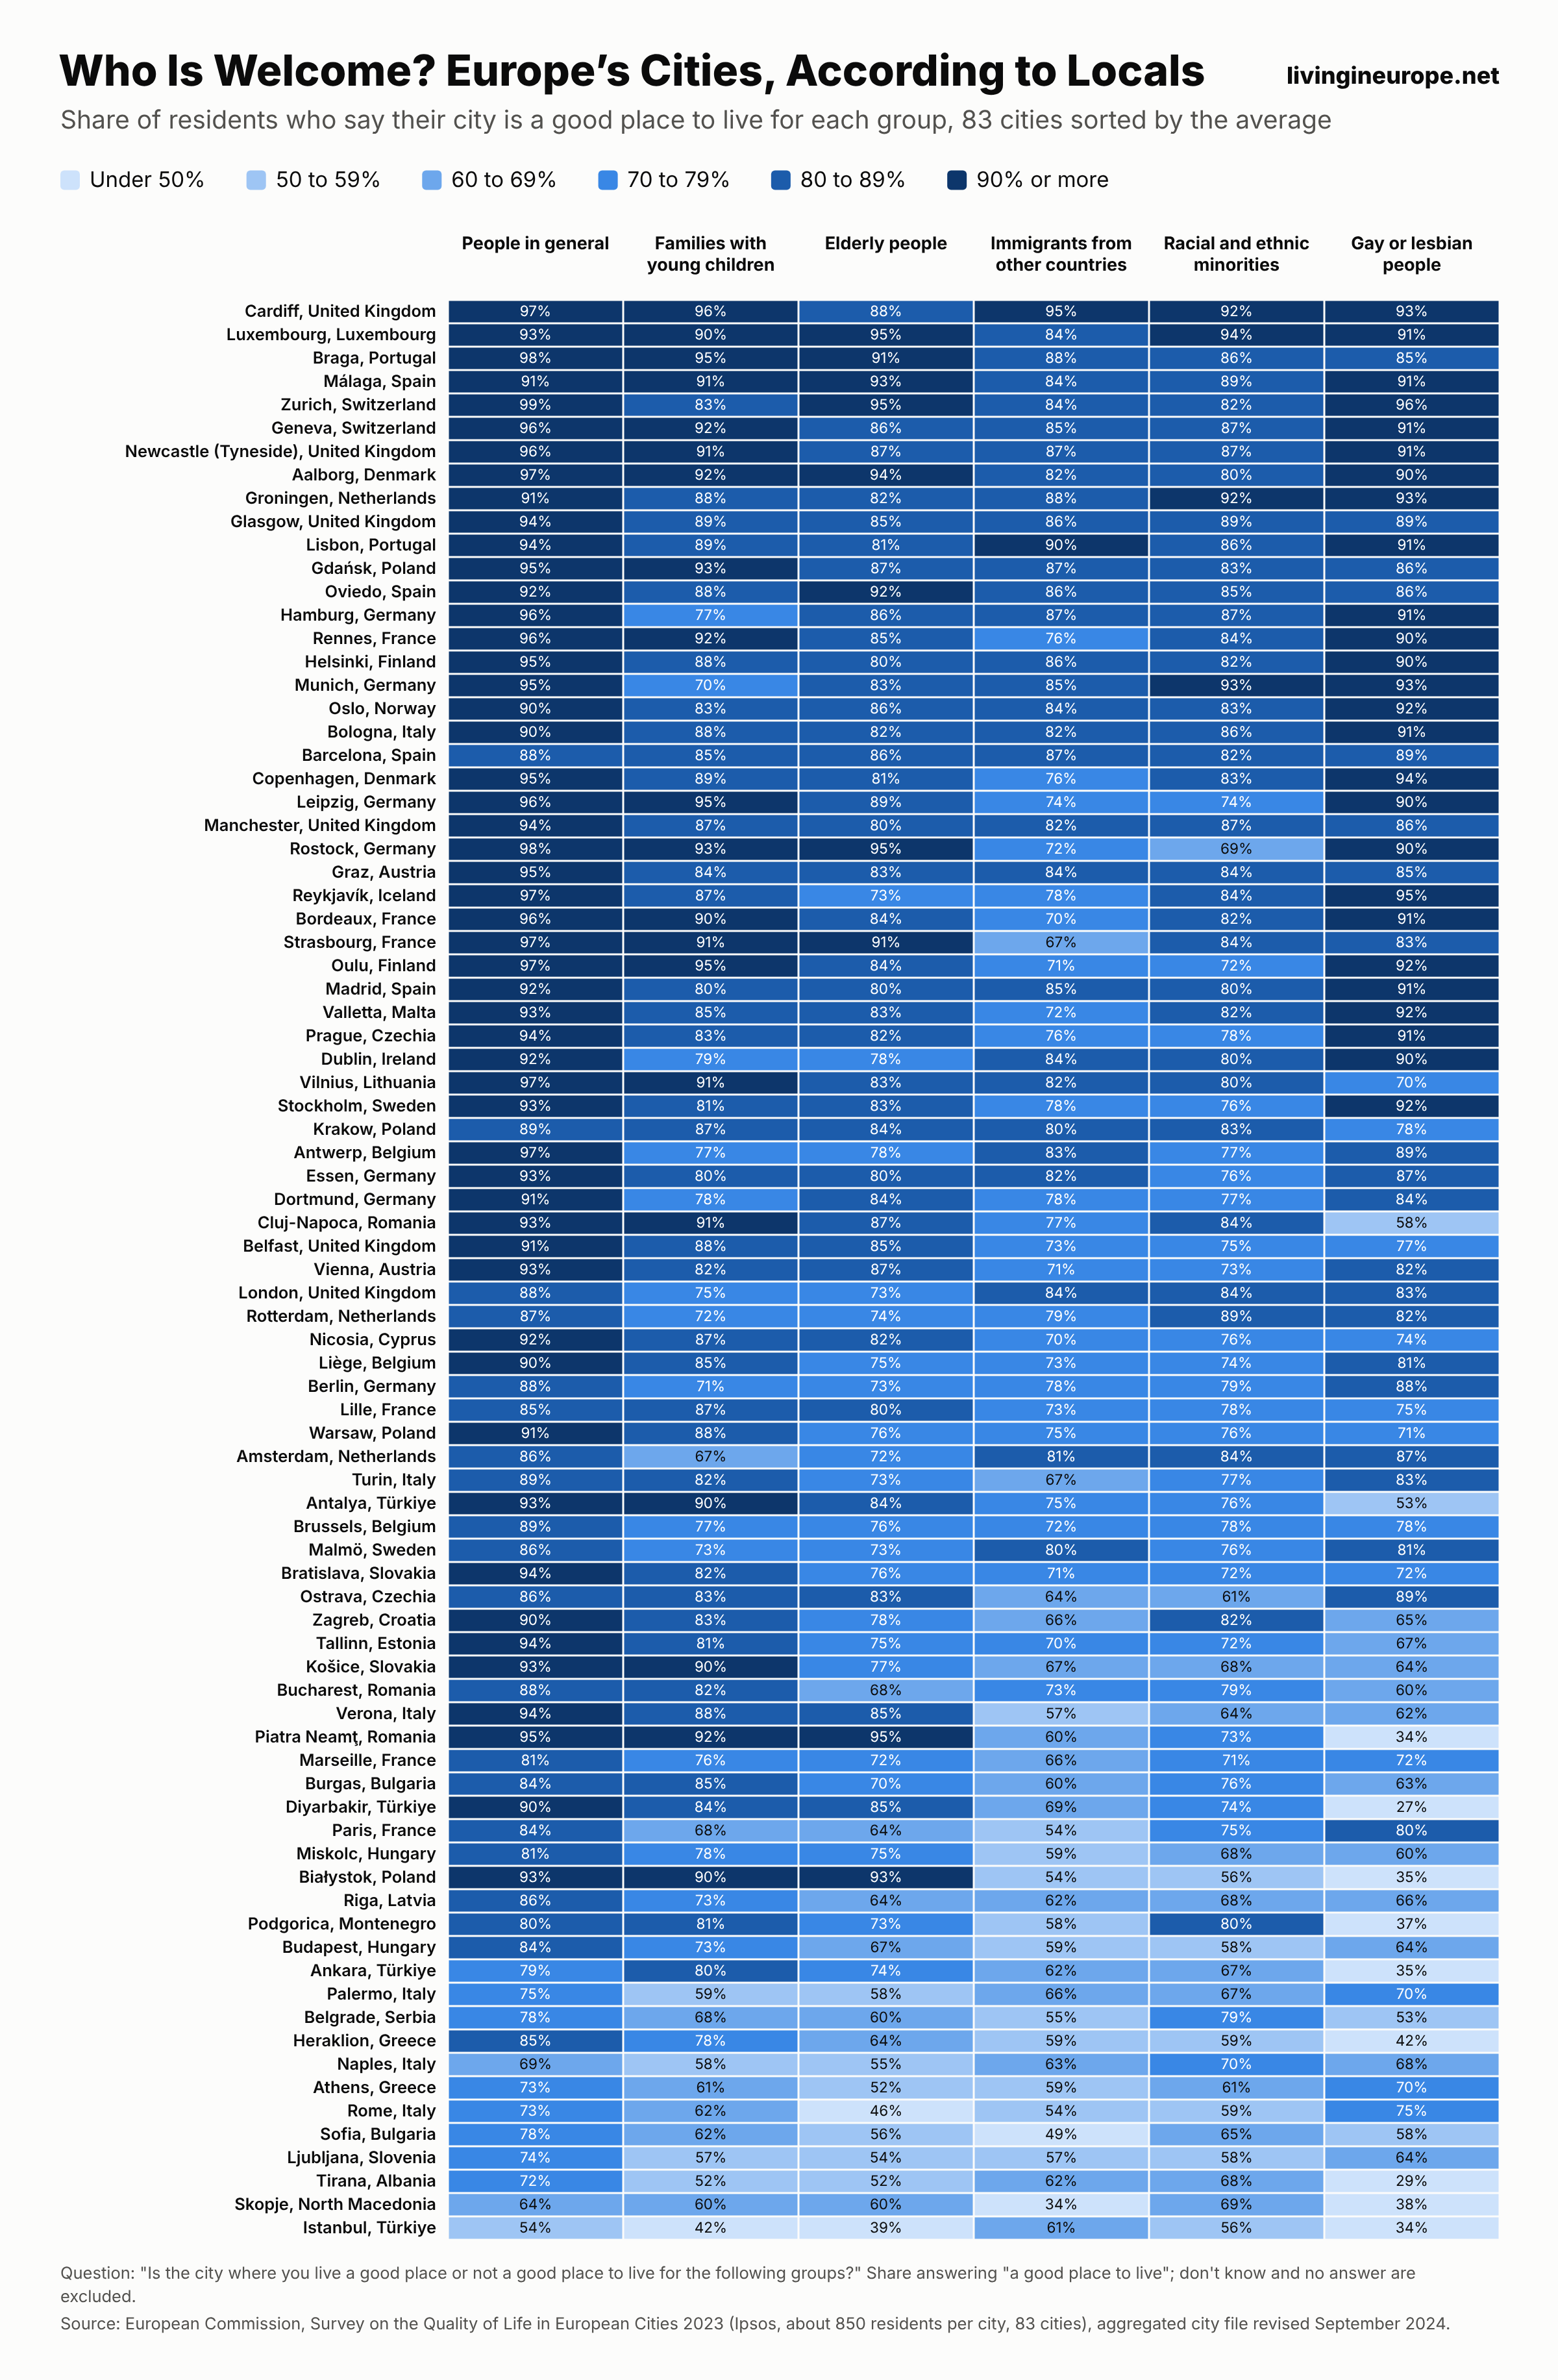
Averaged across all six groups, Cardiff, Luxembourg, Braga and Málaga are where residents most often say their city is a good place to live for everyone. Istanbul, Skopje and Tirana score lowest.
The top cities for each group
- People in general: Zurich (99%), Rostock (98%) and Braga (98%) score highest; Istanbul lowest (54%).
- Families with young children: Cardiff (96%), Oulu (95%) and Braga (95%) score highest; Istanbul lowest (42%).
- Elderly people: Zurich (95%), Rostock (95%) and Luxembourg (95%) score highest; Istanbul lowest (39%).
- Immigrants from other countries: Cardiff (95%), Lisbon (90%) and Braga (88%) score highest; Skopje lowest (34%).
- Racial and ethnic minorities: Luxembourg (94%), Munich (93%) and Groningen (92%) score highest; Istanbul lowest (56%).
- Gay or lesbian people: Zurich (96%), Reykjavík (95%) and Copenhagen (94%) score highest; Diyarbakir lowest (27%).
All 83 cities
Sorted by the average of the six groups. Click a column to sort.
| City | People in general | Families with young children | Elderly people | Immigrants from other countries | Racial and ethnic minorities | Gay or lesbian people |
|---|---|---|---|---|---|---|
| Cardiff, United Kingdom | 97% | 96% | 88% | 95% | 92% | 93% |
| Luxembourg, Luxembourg | 93% | 90% | 95% | 84% | 94% | 91% |
| Braga, Portugal | 98% | 95% | 91% | 88% | 86% | 85% |
| Málaga, Spain | 91% | 91% | 93% | 84% | 89% | 91% |
| Zurich, Switzerland | 99% | 83% | 95% | 84% | 82% | 96% |
| Geneva, Switzerland | 96% | 92% | 86% | 85% | 87% | 91% |
| Newcastle (Tyneside), United Kingdom | 96% | 91% | 87% | 87% | 87% | 91% |
| Aalborg, Denmark | 97% | 92% | 94% | 82% | 80% | 90% |
| Groningen, Netherlands | 91% | 88% | 82% | 88% | 92% | 93% |
| Glasgow, United Kingdom | 94% | 89% | 85% | 86% | 89% | 89% |
| Lisbon, Portugal | 94% | 89% | 81% | 90% | 86% | 91% |
| Gdańsk, Poland | 95% | 93% | 87% | 87% | 83% | 86% |
| Oviedo, Spain | 92% | 88% | 92% | 86% | 85% | 86% |
| Hamburg, Germany | 96% | 77% | 86% | 87% | 87% | 91% |
| Rennes, France | 96% | 92% | 85% | 76% | 84% | 90% |
| Helsinki, Finland | 95% | 88% | 80% | 86% | 82% | 90% |
| Munich, Germany | 95% | 70% | 83% | 85% | 93% | 93% |
| Oslo, Norway | 90% | 83% | 86% | 84% | 83% | 92% |
| Bologna, Italy | 90% | 88% | 82% | 82% | 86% | 91% |
| Barcelona, Spain | 88% | 85% | 86% | 87% | 82% | 89% |
| Copenhagen, Denmark | 95% | 89% | 81% | 76% | 83% | 94% |
| Leipzig, Germany | 96% | 95% | 89% | 74% | 74% | 90% |
| Manchester, United Kingdom | 94% | 87% | 80% | 82% | 87% | 86% |
| Rostock, Germany | 98% | 93% | 95% | 72% | 69% | 90% |
| Graz, Austria | 95% | 84% | 83% | 84% | 84% | 85% |
| Reykjavík, Iceland | 97% | 87% | 73% | 78% | 84% | 95% |
| Bordeaux, France | 96% | 90% | 84% | 70% | 82% | 91% |
| Strasbourg, France | 97% | 91% | 91% | 67% | 84% | 83% |
| Oulu, Finland | 97% | 95% | 84% | 71% | 72% | 92% |
| Madrid, Spain | 92% | 80% | 80% | 85% | 80% | 91% |
| Valletta, Malta | 93% | 85% | 83% | 72% | 82% | 92% |
| Prague, Czechia | 94% | 83% | 82% | 76% | 78% | 91% |
| Dublin, Ireland | 92% | 79% | 78% | 84% | 80% | 90% |
| Vilnius, Lithuania | 97% | 91% | 83% | 82% | 80% | 70% |
| Stockholm, Sweden | 93% | 81% | 83% | 78% | 76% | 92% |
| Krakow, Poland | 89% | 87% | 84% | 80% | 83% | 78% |
| Antwerp, Belgium | 97% | 77% | 78% | 83% | 77% | 89% |
| Essen, Germany | 93% | 80% | 80% | 82% | 76% | 87% |
| Dortmund, Germany | 91% | 78% | 84% | 78% | 77% | 84% |
| Cluj-Napoca, Romania | 93% | 91% | 87% | 77% | 84% | 58% |
| Belfast, United Kingdom | 91% | 88% | 85% | 73% | 75% | 77% |
| Vienna, Austria | 93% | 82% | 87% | 71% | 73% | 82% |
| London, United Kingdom | 88% | 75% | 73% | 84% | 84% | 83% |
| Rotterdam, Netherlands | 87% | 72% | 74% | 79% | 89% | 82% |
| Nicosia, Cyprus | 92% | 87% | 82% | 70% | 76% | 74% |
| Liège, Belgium | 90% | 85% | 75% | 73% | 74% | 81% |
| Berlin, Germany | 88% | 71% | 73% | 78% | 79% | 88% |
| Lille, France | 85% | 87% | 80% | 73% | 78% | 75% |
| Warsaw, Poland | 91% | 88% | 76% | 75% | 76% | 71% |
| Amsterdam, Netherlands | 86% | 67% | 72% | 81% | 84% | 87% |
| Turin, Italy | 89% | 82% | 73% | 67% | 77% | 83% |
| Antalya, Türkiye | 93% | 90% | 84% | 75% | 76% | 53% |
| Brussels, Belgium | 89% | 77% | 76% | 72% | 78% | 78% |
| Malmö, Sweden | 86% | 73% | 73% | 80% | 76% | 81% |
| Bratislava, Slovakia | 94% | 82% | 76% | 71% | 72% | 72% |
| Ostrava, Czechia | 86% | 83% | 83% | 64% | 61% | 89% |
| Zagreb, Croatia | 90% | 83% | 78% | 66% | 82% | 65% |
| Tallinn, Estonia | 94% | 81% | 75% | 70% | 72% | 67% |
| Košice, Slovakia | 93% | 90% | 77% | 67% | 68% | 64% |
| Bucharest, Romania | 88% | 82% | 68% | 73% | 79% | 60% |
| Verona, Italy | 94% | 88% | 85% | 57% | 64% | 62% |
| Piatra Neamţ, Romania | 95% | 92% | 95% | 60% | 73% | 34% |
| Marseille, France | 81% | 76% | 72% | 66% | 71% | 72% |
| Burgas, Bulgaria | 84% | 85% | 70% | 60% | 76% | 63% |
| Diyarbakir, Türkiye | 90% | 84% | 85% | 69% | 74% | 27% |
| Paris, France | 84% | 68% | 64% | 54% | 75% | 80% |
| Miskolc, Hungary | 81% | 78% | 75% | 59% | 68% | 60% |
| Białystok, Poland | 93% | 90% | 93% | 54% | 56% | 35% |
| Riga, Latvia | 86% | 73% | 64% | 62% | 68% | 66% |
| Podgorica, Montenegro | 80% | 81% | 73% | 58% | 80% | 37% |
| Budapest, Hungary | 84% | 73% | 67% | 59% | 58% | 64% |
| Ankara, Türkiye | 79% | 80% | 74% | 62% | 67% | 35% |
| Palermo, Italy | 75% | 59% | 58% | 66% | 67% | 70% |
| Belgrade, Serbia | 78% | 68% | 60% | 55% | 79% | 53% |
| Heraklion, Greece | 85% | 78% | 64% | 59% | 59% | 42% |
| Naples, Italy | 69% | 58% | 55% | 63% | 70% | 68% |
| Athens, Greece | 73% | 61% | 52% | 59% | 61% | 70% |
| Rome, Italy | 73% | 62% | 46% | 54% | 59% | 75% |
| Sofia, Bulgaria | 78% | 62% | 56% | 49% | 65% | 58% |
| Ljubljana, Slovenia | 74% | 57% | 54% | 57% | 58% | 64% |
| Tirana, Albania | 72% | 52% | 52% | 62% | 68% | 29% |
| Skopje, North Macedonia | 64% | 60% | 60% | 34% | 69% | 38% |
| Istanbul, Türkiye | 54% | 42% | 39% | 61% | 56% | 34% |
How we built this
The survey asked: “Is the city where you live a good place or not a good place to live for the following groups?” for people in general, racial and ethnic minorities, gay or lesbian people, immigrants from other countries, families with young children and elderly people. We show the share who said “a good place to live”, leaving out people who did not know or did not answer. These are residents’ views, not official measures of discrimination or services.
Source: European Commission, Survey on the Quality of Life in European Cities 2023, run by Ipsos with about 850 residents in each of 83 cities in the EU, EFTA, the UK, the Western Balkans and Türkiye. We used the Commission’s aggregated city file (revised September 2024). Last checked October 15, 2026.
Frequently asked questions
Which European city is best for families, according to locals?
Cardiff had the highest share of residents saying it is a good place for families with young children (96%).
Which European city do locals see as best for immigrants?
Cardiff led (95%), followed by Lisbon and Braga.